I&M BANK 2025 CTF-Network Forensics Writeup
Catch if you can
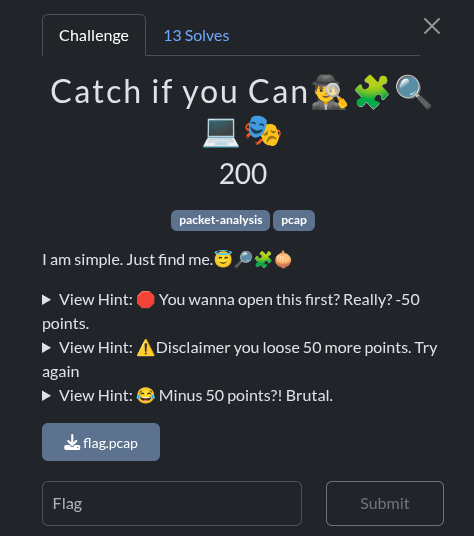
We were given this pcap file analyze.
Given this pcap file, the first thing I did was apply the filter frame contains “flag” to check if any packets contained references to a flag. Two packets appeared, each with a GET request—one for flag.txt and the other for flaggy.txt.

This looked like the right place to find the flag, so I followed each stream. I started with flag.txt and noticed a Base64-encoded string.
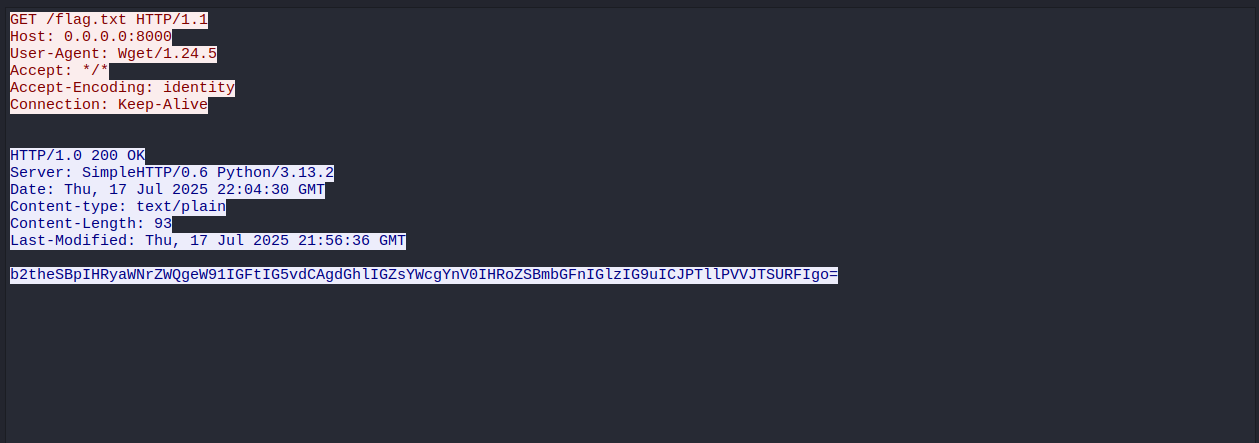 Decoding it in CyberChef produced the message: “okay i tricked you, I’m not the flag, but the flag is on ‘ONYOURSIDE’.” This seemed like a clue, so I went back and applied the filter frame contains “on your side”.

I then followed the corresponding HTTP stream and found another Base64-encoded string, which, when decoded, revealed inm{iandm_we_are_on_your_side}.
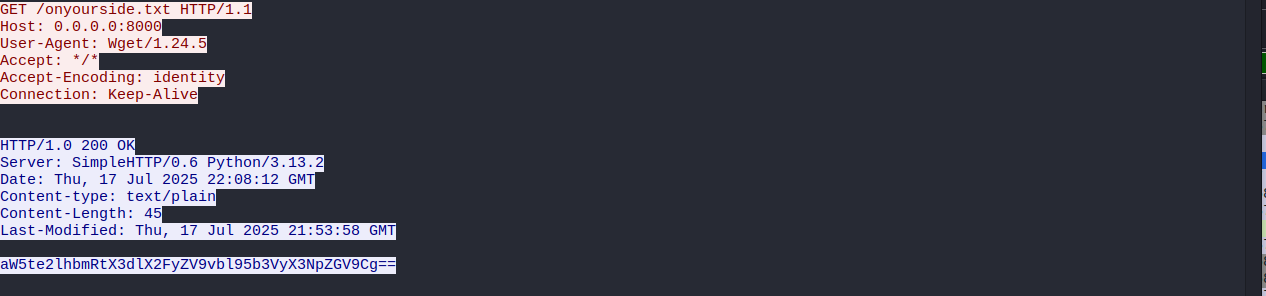
I got the flag inm{iandm_we_are_on_your_side}
The Lost Transaction Ledger
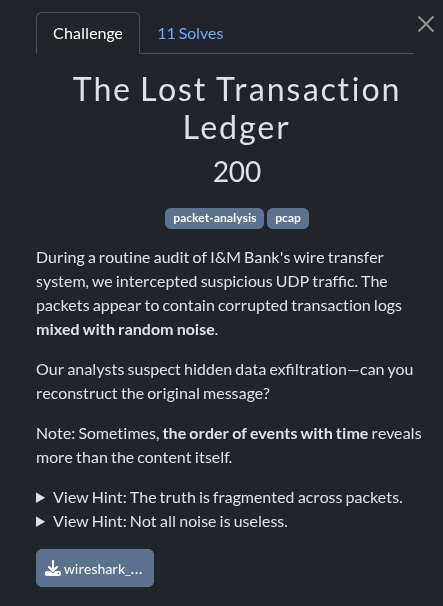
We were given this pcap file analyze.
As in the previous question, I applied the filter frame contains “flag” to check whether any packets contained reference to the flag but oops no packet appeared. This meant I had to take a different approach. At this point, I decided to switch from the Wireshark GUI to tshark, the command-line version of Wireshark. I chose tshark because it allows for faster and more precise data extraction, especially when dealing with large packet captures or when I need to automate or script my analysis. Instead of manually scrolling through packets, tshark lets me apply filters, extract specific fields, and even pipe the output directly into other tools for decoding or processing. To start, I examined the UDP packets within the PCAP file using tshark to extract the data fields:
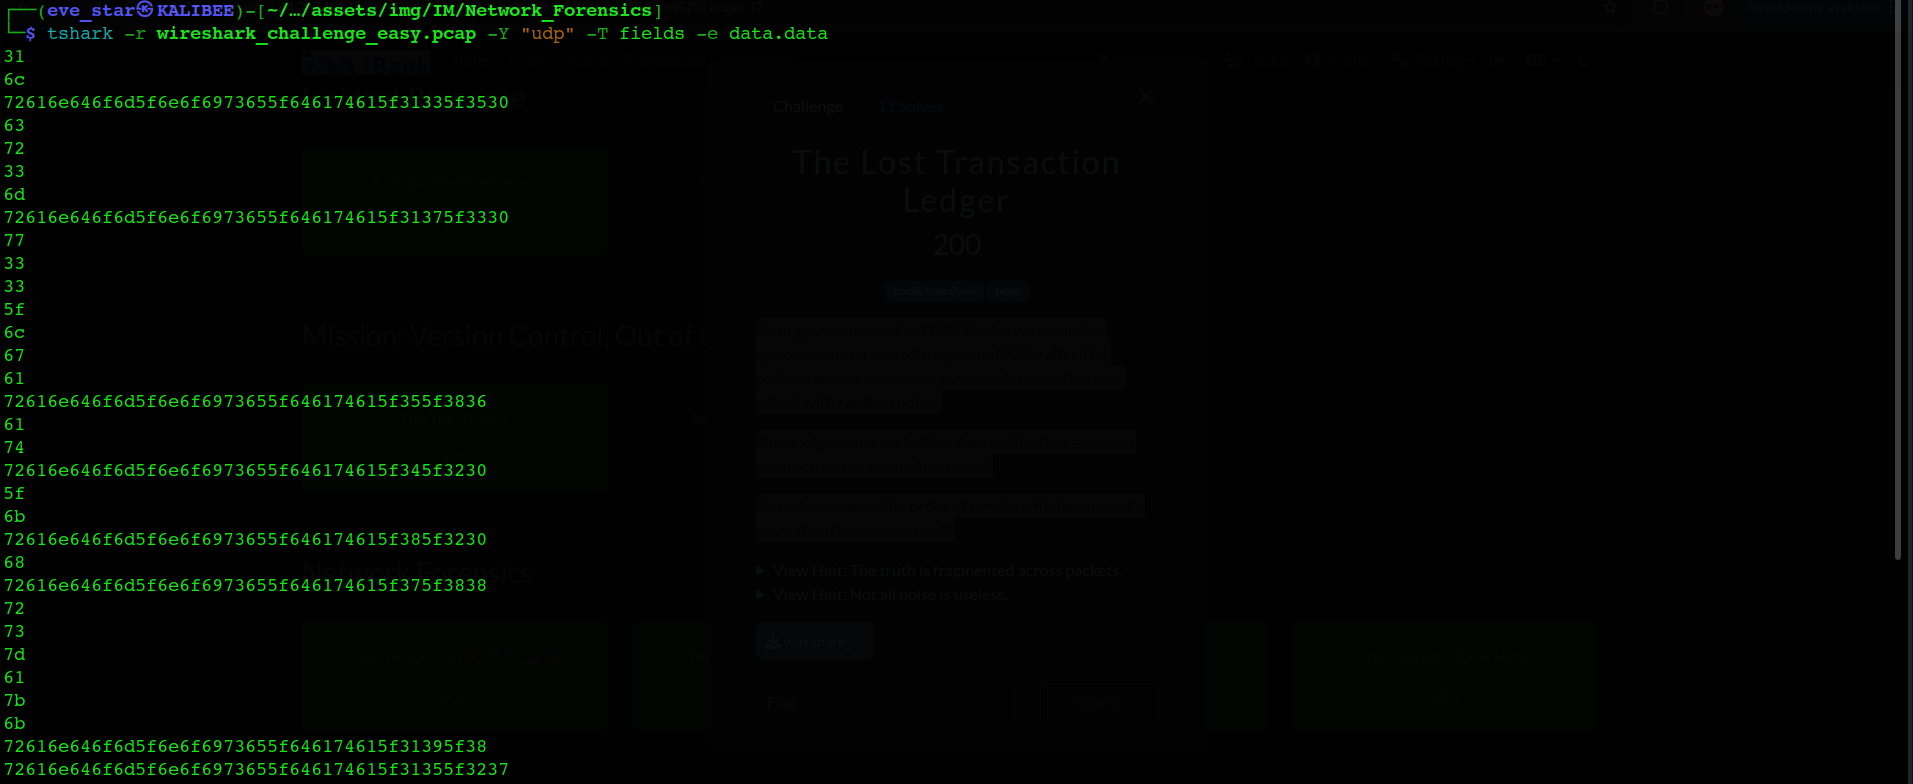
To make the output more readable, I converted the hex values into ASCII text using xxd:

The content looked random at first glance, but patterns like random_noise_data caught my attention.To isolate the meaningful parts, I used a sed command to remove all occurrences of the random_noise_data pattern:

The output became much shorter: 1lcr3mw33_lgaat_khrs}a{kb_nmfw1 The message looked scrambled—almost like the pieces were out of order. Remembering the challenge hint about “the order of events with time”, I suspected the packets needed to be rearranged chronologically.To reconstruct the correct order, I extracted both the epoch timestamp and the data field, then sorted the output numerically by time:

I got the flag flag{w3lc0m3_t0_1mbank_w1r3shark}
DNS Data Heist
We were given this pcap file analyze.
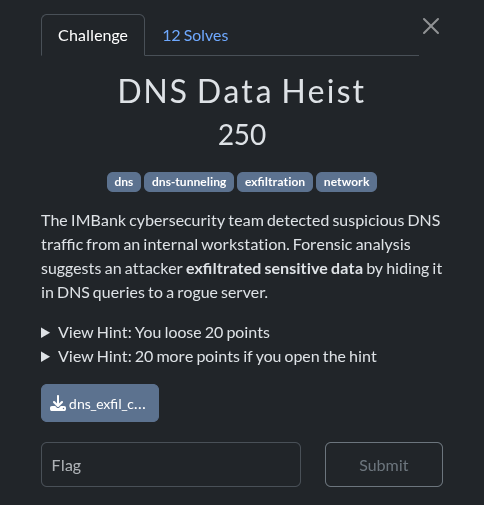 For this challenge, I opted to use tshark since it can chain multiple commands together in a pipeline for streamlined analysis as well as automation. I filtered for DNS packets that are queries (response flag == 0) and printed the queried domain name field.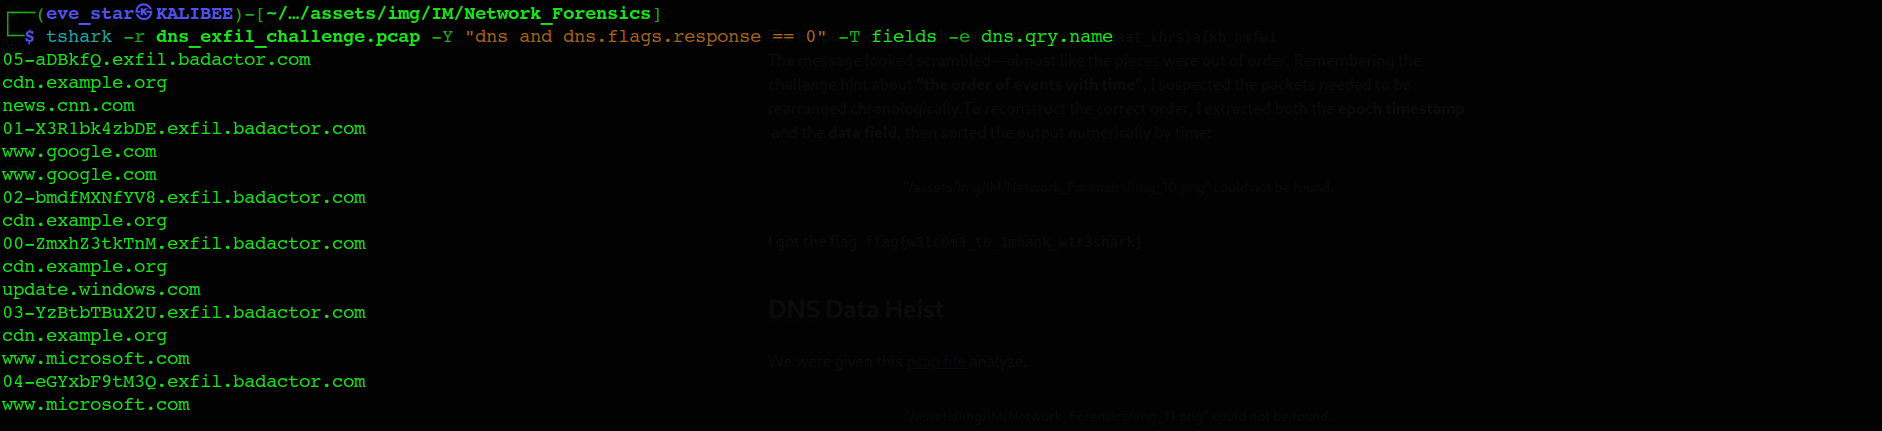
This confirmed repeated queries to exfil.badactor.com with leftmost labels that look like NN-<base64>. The attacker encoded data in subdomain labels prefixed by a two-digit chunk index (00, 01, …). I extracted only those names and sorted them numerically to restore chunk order: 
I stripped away the domain structure to isolate only the encoded data: 
I then concatenated all the Base64 strings and decoded them: 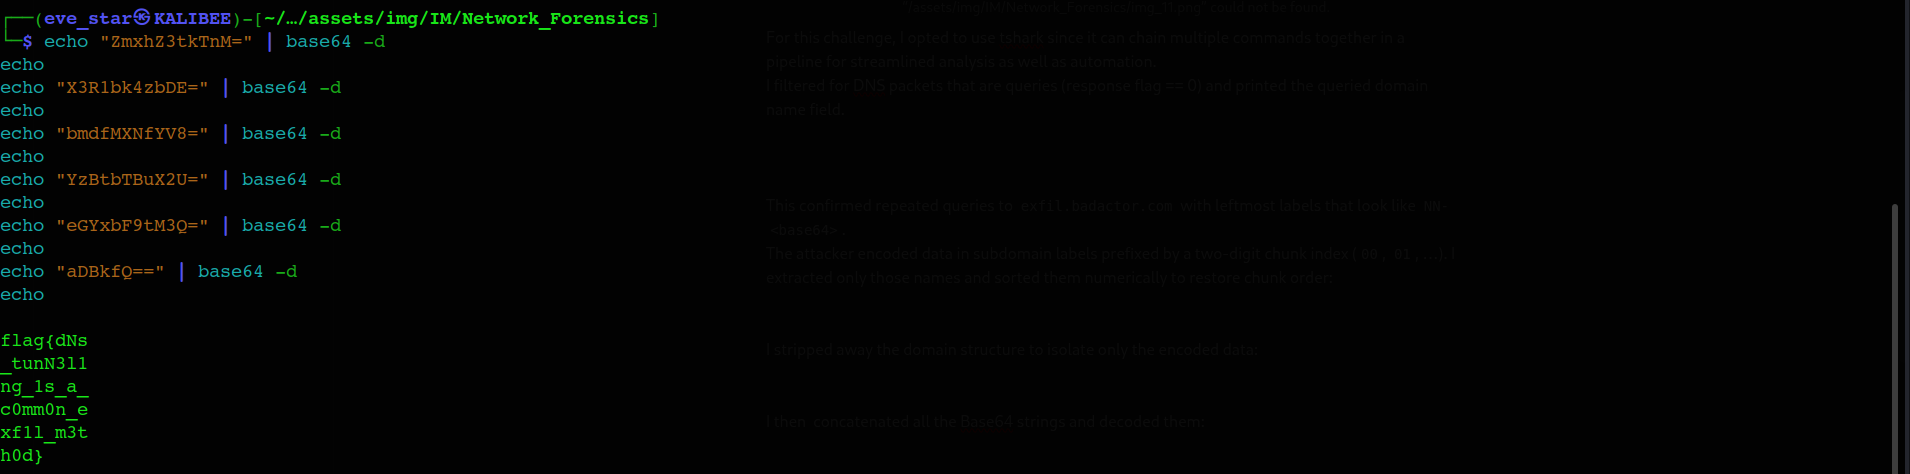
I found the flag flag{dNs_tunN3lng_1s_a_c0mm0n_exf1l_m3th0d}